


Advanced environmental analysis services
The UrbiVerde platform provides users with services and indicators that help them better understand urban dynamics and feed into decision-support tools, guiding local action in urban planning and territorial resilience.
Developed through previous projects carried out with committed local authorities and based on their operational needs, these services cover a range of urban topics related to the environment, mobility, and land-use planning. They are organized into four main thematic groups:
These services can, among other things, detect vegetation in urban areas, identify its structure (shrub, tree, or herbaceous) and its spatial organization (isolated, in rows, or in wooded areas). They also provide detailed indicators to characterize vegetation, including type (evergreen or deciduous, coniferous or broadleaf), height (minimum, average, and maximum), and occupied area.
The use cases and the first round of discussions with users enabled us to identify three levels of services of interest, progressively adding value to the wealth of available data and moving towards climate resilience analyses based on the components of the initial datasets.
Level 1 services represent the first tier, providing a wide range of urban observations and indicators.
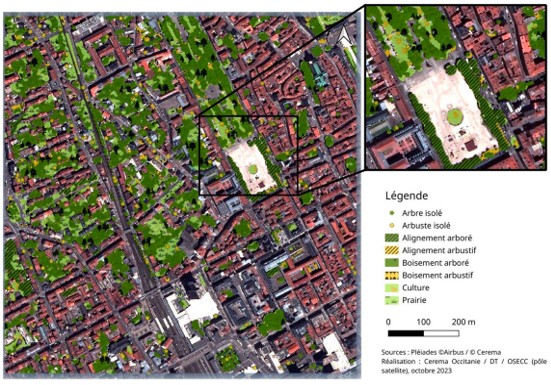
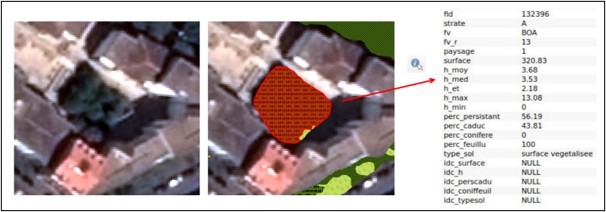
Urban Vegetation Mapping and Characterization Services
- Detect vegetation, its structure (shrub, tree, or herbaceous), and its spatial pattern (isolated, in rows, or wooded areas).
- Vegetation mapping.
- Determine the characteristics of the detected vegetation.
- Percentage of evergreen/deciduous and coniferous/broadleaf vegetation.
- Heights (minimum, average, and maximum) and area covered.
Urban Vegetation Health Service
- Monitor the health and vitality of urban vegetation over time, detecting areas affected by environmental stress and tracking how vegetation conditions evolve.
- Provide a spatially explicit vegetation-health indicator derived from EO data. A Vegetation Health Index (VHI) combines vegetation greenness/condition derived from NDVI with temperature stress derived from Land Surface Temperature, accounting for seasonal and historical variability.
- Deliver frequently updated vegetation-health maps and indicators, with a targeted spatial resolution of 1–10 m and at least weekly observations.
- Support operational management and climate-adaptation decisions, helping cities identify stressed vegetation early, prioritise maintenance or restoration actions, manage green infrastructure, and evaluate urban-greening strategies.
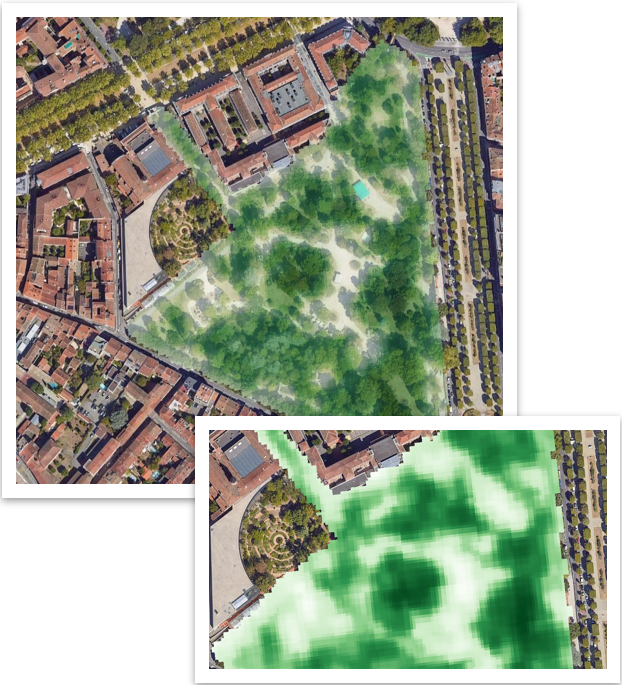

Urban Heat Island (UHI) Service
- Map urban surface temperatures to identify overheating hotspots, providing a spatial diagnosis of where heat accumulates across the urban fabric and how these patterns evolve over time. The LST service targets high-resolution 10 m maps, derived from Landsat thermal observations enhanced with Sentinel-2 imagery.
- Characterise and explain Urban Heat Island patterns by linking temperature with land cover.
- Support cities in prioritising heat-adaptation interventions.
- Provide the observational baseline for broader climate-adaptation services.
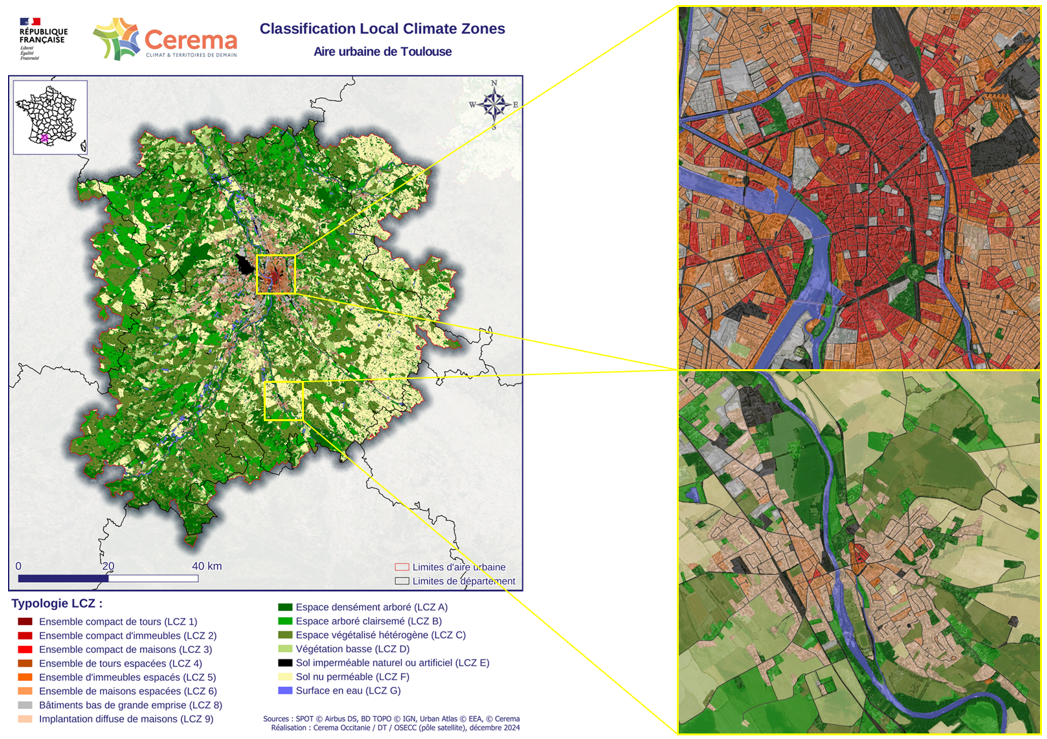
Local Climat Zone Service (LCZ)
- Identify urban areas that are more vulnerable to the urban heat island effect.
- Based on information on urban morphology and land use.

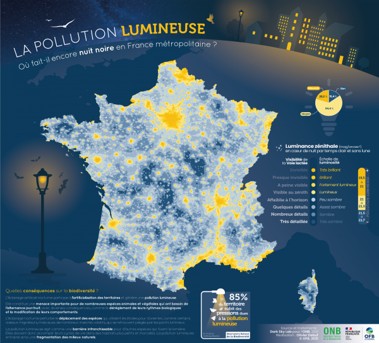
Light Pollution
- Identify public lighting switch-offs.
- Determine the share of the territory significantly affected by light pollution, as well as its level of intensity.
Air Quality Service
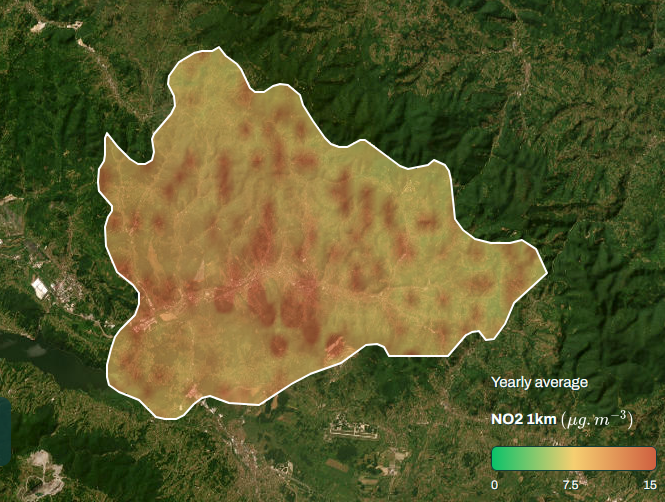
- Monitor concentrations of key air pollutants (NO₂, PM2.5 and PM10 ) over time, providing maps and indicators that allow cities to quantify pollution levels and identify areas with degraded air quality.
- Provide neighbourhood-scale information on air pollution by downscaling NO₂ data to 1 km resolution over Europe. The approach combines CAMS atmospheric data with EO and contextual information such as meteorology, population and road networks, with ground-station measurements used for validation.
- Assess population exposure and health-relevant pollution conditions, including exceedances against WHO thresholds.
- Support air-quality management and nature-based adaptation strategies.
Infrastructure & Population Characteristic Services
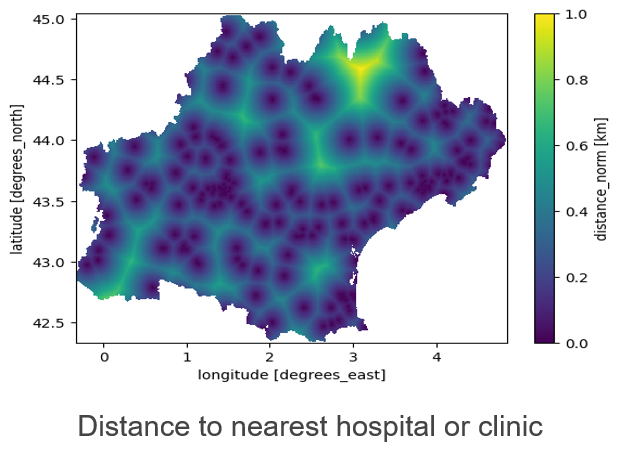
- Provide a spatial picture of the people and key infrastructure across the territory, combining gridded population density, socio-demographic characteristics and local infrastructure/points of interest such as schools, health facilities and amenities.
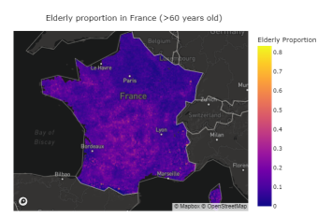
- Characterise population exposure and vulnerability to environmental risks, by locating where people live and identifying vulnerable groups (notably elderly populations).
- Contextualise environmental indicators with the people and services they affect.
- Support better targeting of urban resilience and adaptation actions, by bringing together environmental hazards, population exposure/vulnerability and territorial assets to identify where interventions may be needed.
Level 2 services rely on a more advanced level of processing, combining the observations and indicators described above to identify the ecosystem services (ES) provided by green and blue infrastructure. The assessment of ecosystem services is based on vegetation mapping and characterization, complemented by other observations.
Air Pollution Reduction
- Assess the contribution of urban vegetation to reducing air pollution, combining vegetation information with air-quality observations to quantify the air-quality ecosystem service provided by green infrastructure.
- Identify where green infrastructure and nature-based solutions can provide the greatest air-quality benefits, supporting the prioritisation of greening actions across neighbourhoods and the valuation of existing vegetation as an environmental asset.
- Support comparison of neighbourhoods and greening scenarios, providing cities with evidence for planning nature-based air-quality interventions and connecting observed environmental conditions with actionable ecosystem-service information.
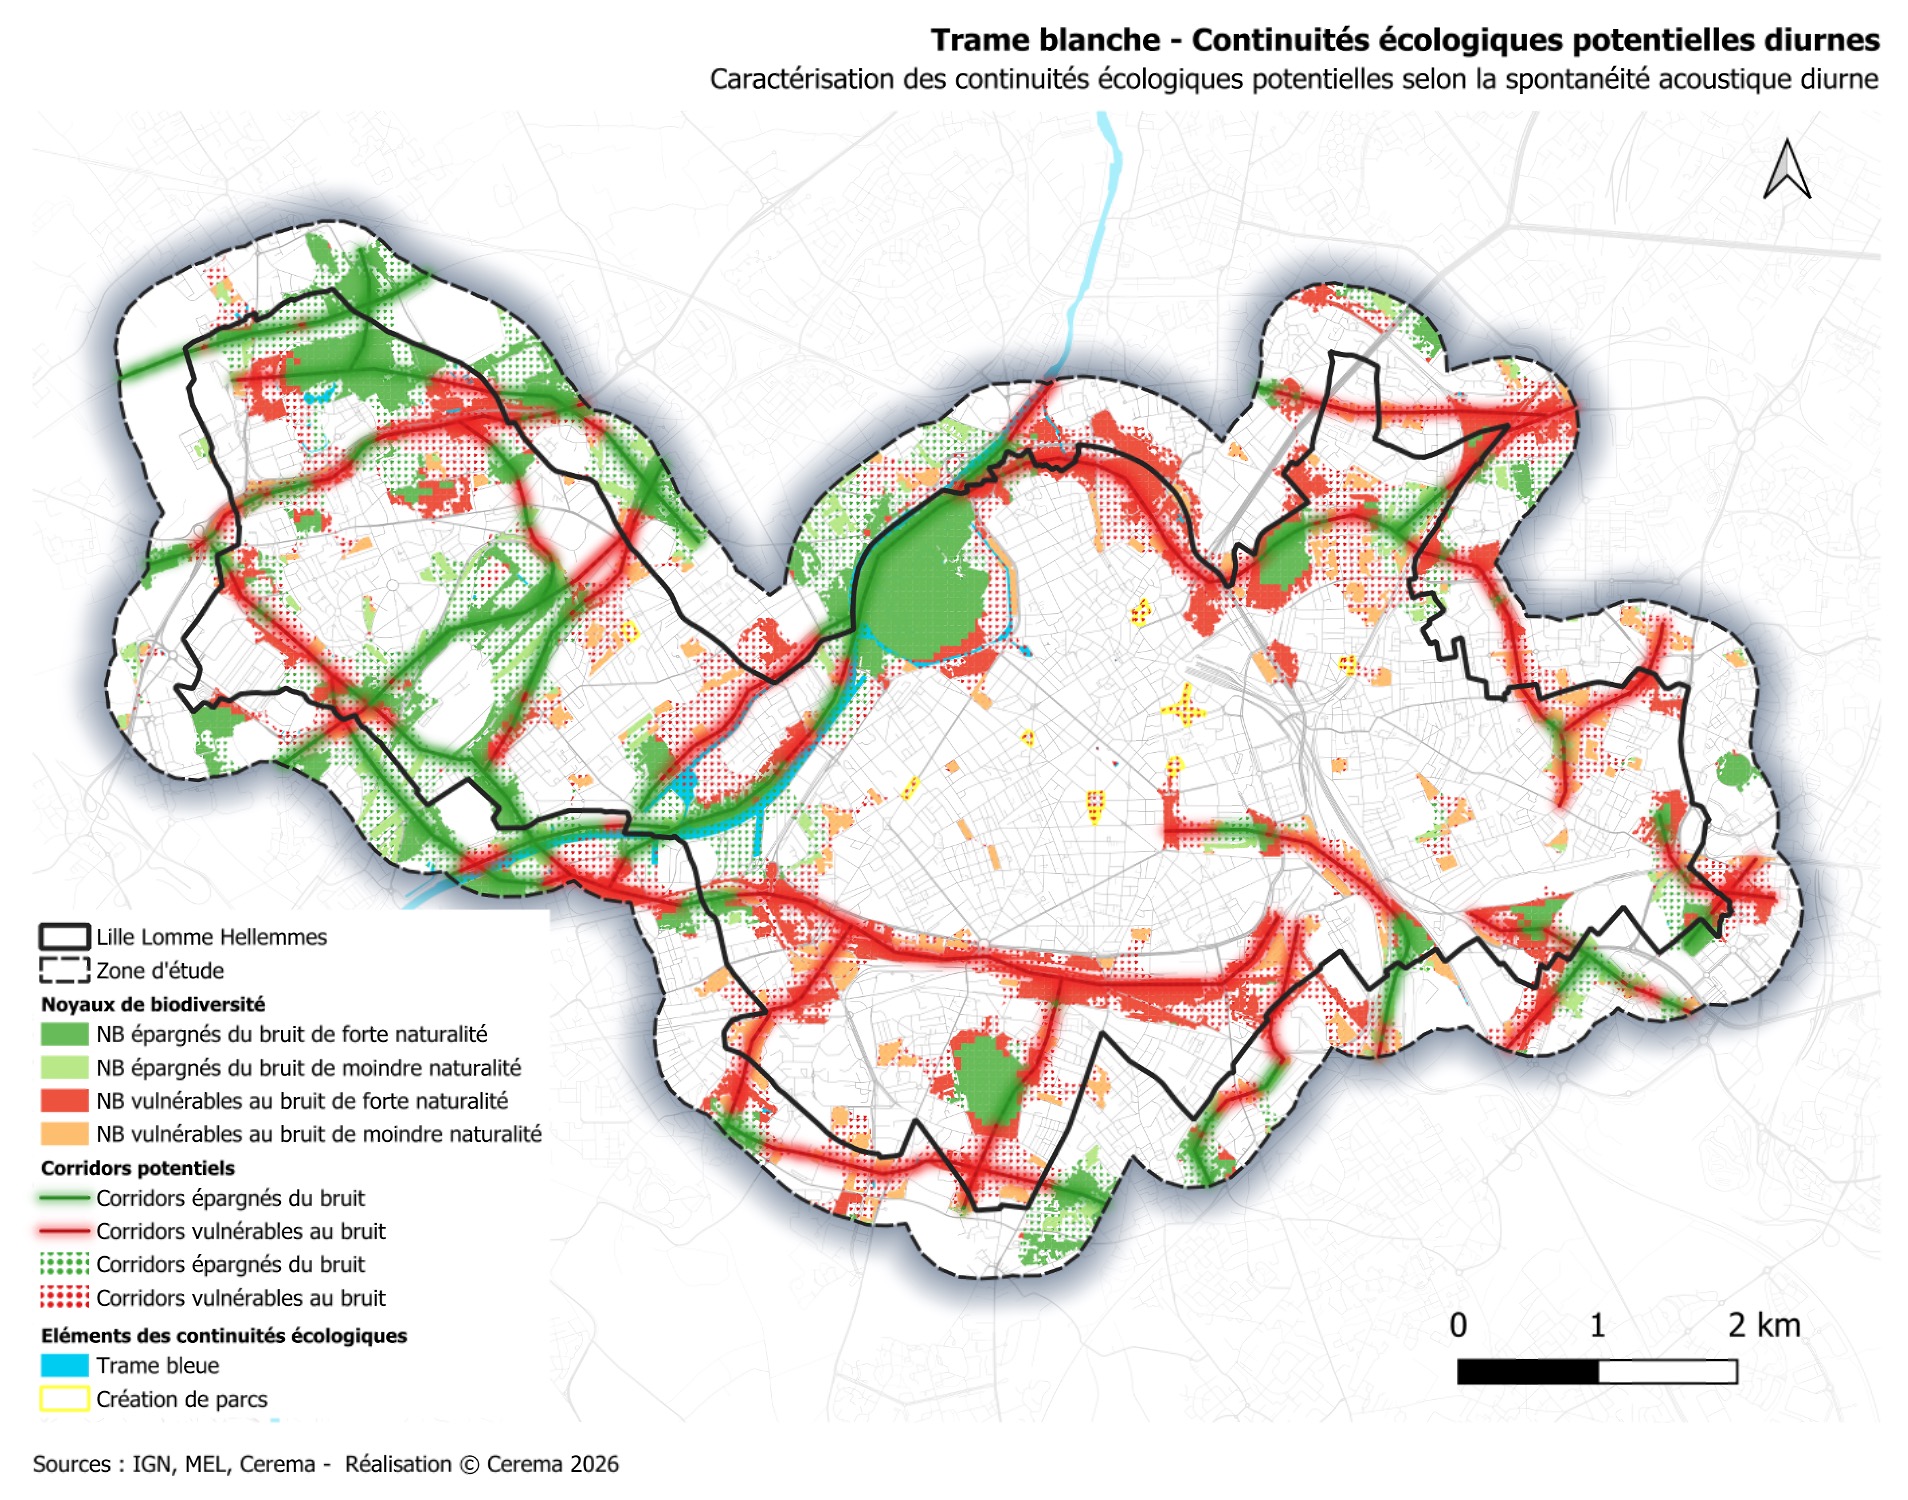
Noise Pollution
- Identify urban ecological corridors.
- Model acoustic conditions to identify noise pollution.
- Highlight ecological corridors that are vulnerable to noise pollution.
Green and Blue Corridors
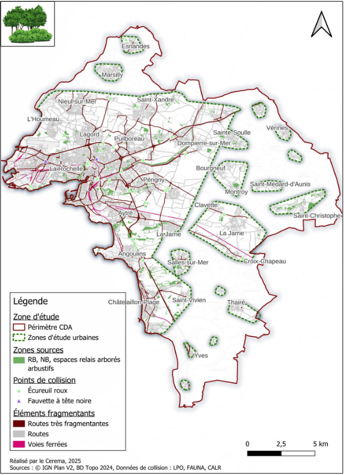
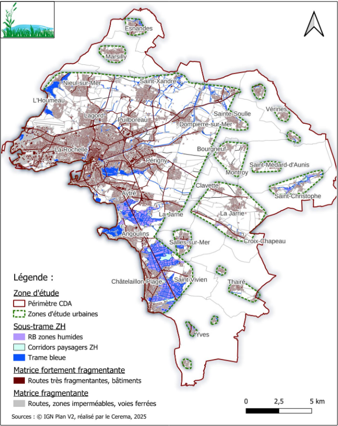
- Identify anthropogenic fragmentation features.
- Identify biodiversity core areas and ecological corridors.
- Identify urban ecological connectivity.
Urban Cooling
- Assess the cooling capacity provided by urban vegetation.
- Simulate the impact of greening and land-cover changes on urban temperatures, allowing users to create “what-if” scenarios and assess how changes to vegetation or surfaces could modify local thermal conditions.
- Compare adaptation options before implementing an urban development project, helping cities evaluate alternative greening or land-cover interventions and identify strategies that can improve urban cooling.
- Provide the bridge between current observations and future climate adaptation.
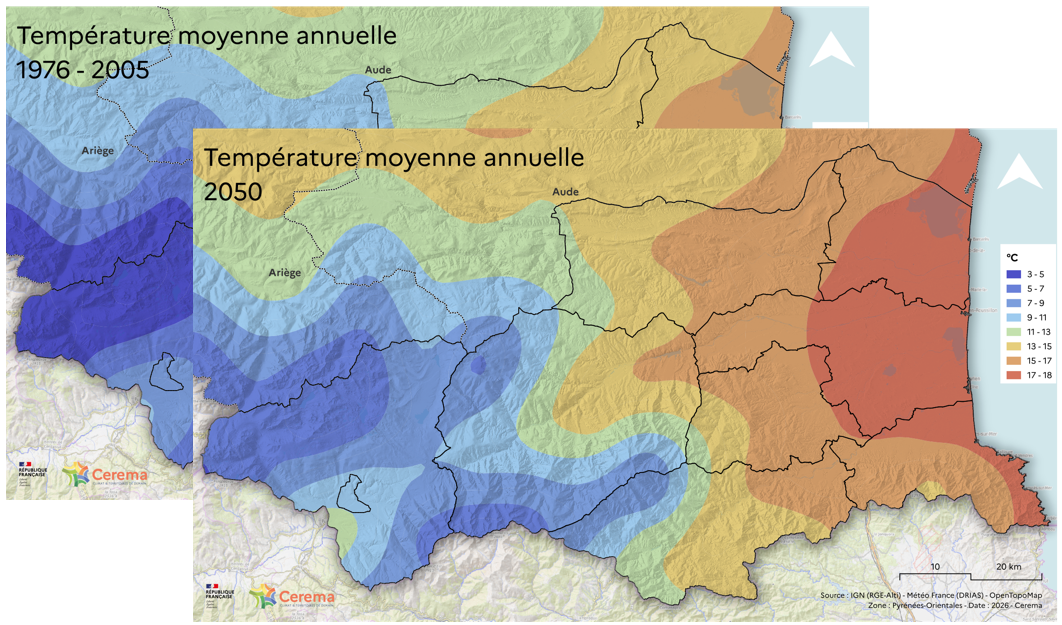
Local Climatic Projection
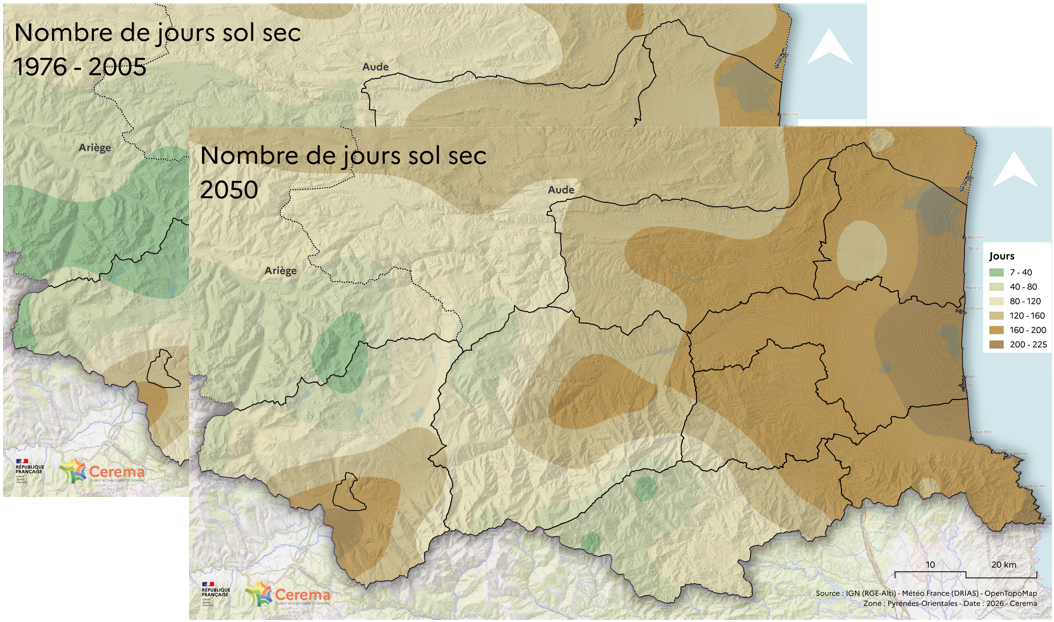
- Compute spatialized climate change indicators (drought, river flows, …) based on climate projection data derived from climate model simulations, following Representative Concentration Pathways (RCPs).
- Perform calculations and analyses over different time horizons (2050-2100).
Urban Vegetation Health Projection
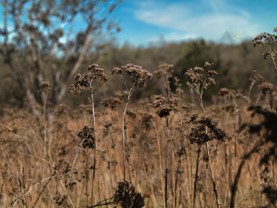
- Project how urban vegetation health could evolve under future climate conditions, moving beyond current vegetation monitoring to provide a forward-looking view of potential climate impacts on urban green areas.
- Combine current vegetation information with local climate projections.
- Support long-term urban greening and climate-adaptation planning, helping cities move from observing vegetation condition today toward anticipating where vegetation may become more vulnerable as climatic conditions evolve.
- Provide scenario-oriented decision support rather than only observation.
Urban Cooling Projection
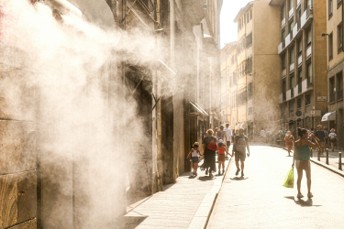
- Project how urban thermal conditions and cooling capacity could evolve under future climate conditions.
- Combine current urban-cooling assessments with local climate projections.
- Deliver projected LST and cooling-capacity layers at future horizons, providing spatial information on where overheating may intensify and how the cooling capacity of the urban environment could change.
- Support long-term climate-adaptation and urban-planning decisions, allowing cities to anticipate future overheating and use scenario-oriented information to inform greening, land-cover and other cooling strategies.